To improve the monitoring of forest restoration projects, remote sensing can provide complementary indicators and support field surveys. By making it possible to monitor canopy diversity, the spatial distribution of plant species and forest evolution over time, the spectral species method and its associated tools developed by Reforest'Action are invaluable in forest management and restoration projects. They aim to enable forest managers to evolve their practices in order to optimize species diversity, as well as the stability and resilience of the forest ecosystem as a whole.
Remote sensing applied to the monitoring of vegetation
Analyzing terrestrial ecosystems from space
Space-based remote sensing enables us to observe terrestrial environments using remote data acquisition methods based on the properties of electromagnetic radiation. Satellite sensors can measure the amount of energy (reflectance) reflected or emitted by a surface as a function of the wavelength of the electromagnetic spectrum, and analyze and monitor changes in the surface over time. The total reflectance recorded in each spectral band (blue, green, red, infrared, etc.) forms the object's “spectral signature”. Each surface thus has its own spectral signature, enabling it to be identified on satellite images.
Defining the spectral signature of plant species
Remote sensing makes it possible to establish the spectral signature of plants by analyzing their optical properties in the visible, near-infrared and mid-infrared ranges. These properties depend in particular on the vegetation's cellular structure, as well as its water and pigment content.
- Cell structure. The anatomical structure of leaves plays a significant role in the spectral signature of vegetation at longer wavelengths. Near-infrared radiation passes through the leaf to the cell layer, where oxygen and carbon dioxide are exchanged in the processes of photosynthesis and respiration. In this layer, near-infrared radiation is strongly reflected. It therefore depends directly on leaf anatomy.
- Water content. Leaf water content is also a factor influencing vegetation's spectral signature in the mid-infrared wavelengths. The higher the water content, the lower the reflectance of vegetation. In remote sensing, this wavelength range is used to identify water-stressed vegetation cover.
- Leaf pigment content. All plants contain green pigments (chlorophyll), orange pigments (carotenes) and blue-red pigments (anthocyanins). The presence of these leaf pigments (particularly chlorophyll, which is the most abundant) in plants is responsible for their high absorption of visible radiation.
These three elements vary according to season, plant species and life cycle. In other words, the spectral signature of vegetation is not constant. It reflects differences in the structure and characteristics of plant cover.
The spectral species method
From spectral signatures to spectral species: identifying the spatial distribution of plant species
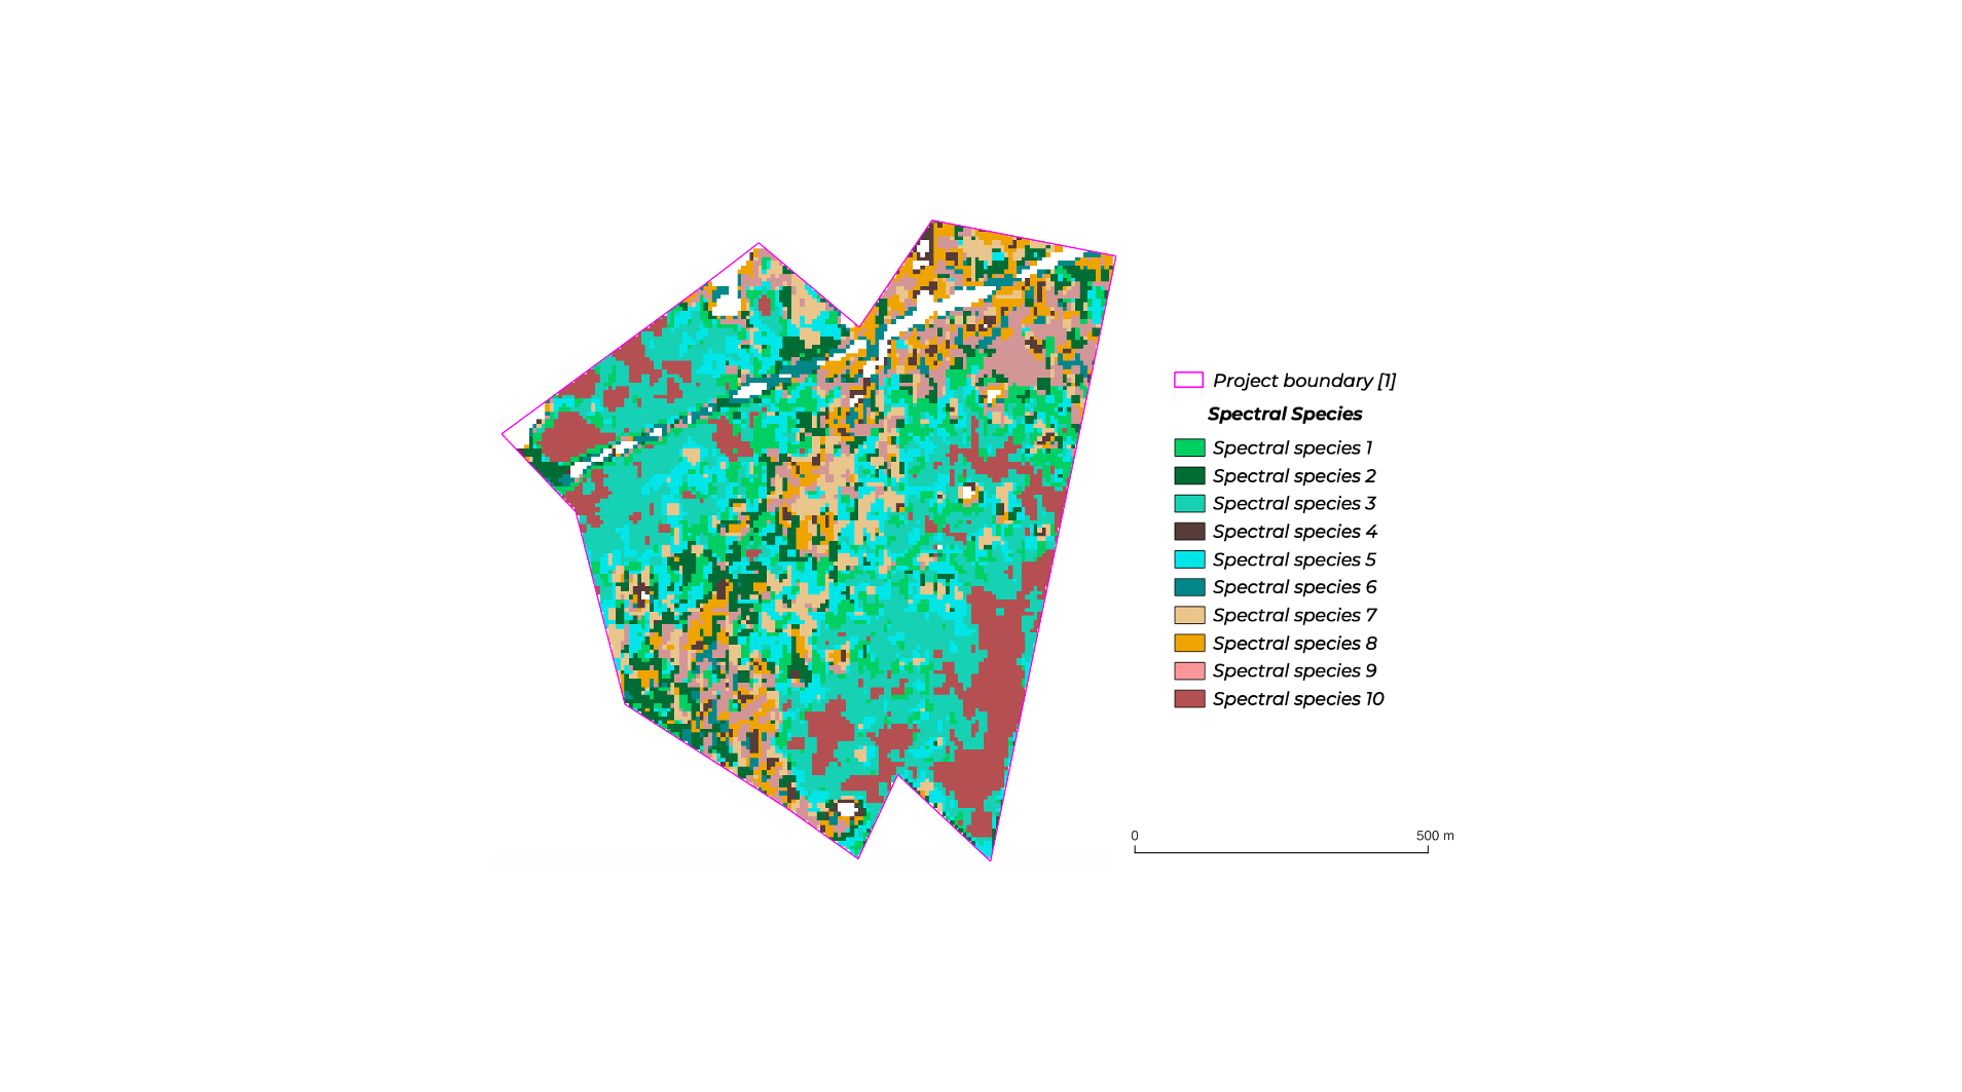
At the scale of a forest plot, remote sensing can identify different spectral signatures, which can be distinguished and attributed to distinct plant species, grouped under categories known as “spectral species”.
“Through opensource platforms, we have access to Copernicus satellite data, which is revisited every five days or so. We can download the current satellite view of a plot within one of our projects by entering its GPS coordinates,” explains Richard Sourbès, Impact Officer for Reforest'Action. “We then process this data using the Python programming language. On the satellite view, each pixel represents a surface that emits energy in 12 spectral bands. These reflectances in each spectral band are recovered by our software. They make up the spectral signature of the forest surface analyzed. We then try to classify each pixel into groups called spectral species according to the similarity of their signatures, and we thus obtain an estimate of the number of different species present in the canopy.”
This method provides a map of the spatial distribution of spectral species observed in the forest. The map takes the form of a satellite view of the plot, with each pixel color corresponding to a spectral species.
From the spatial distribution of species to an index of their diversity: monitoring plant biodiversity
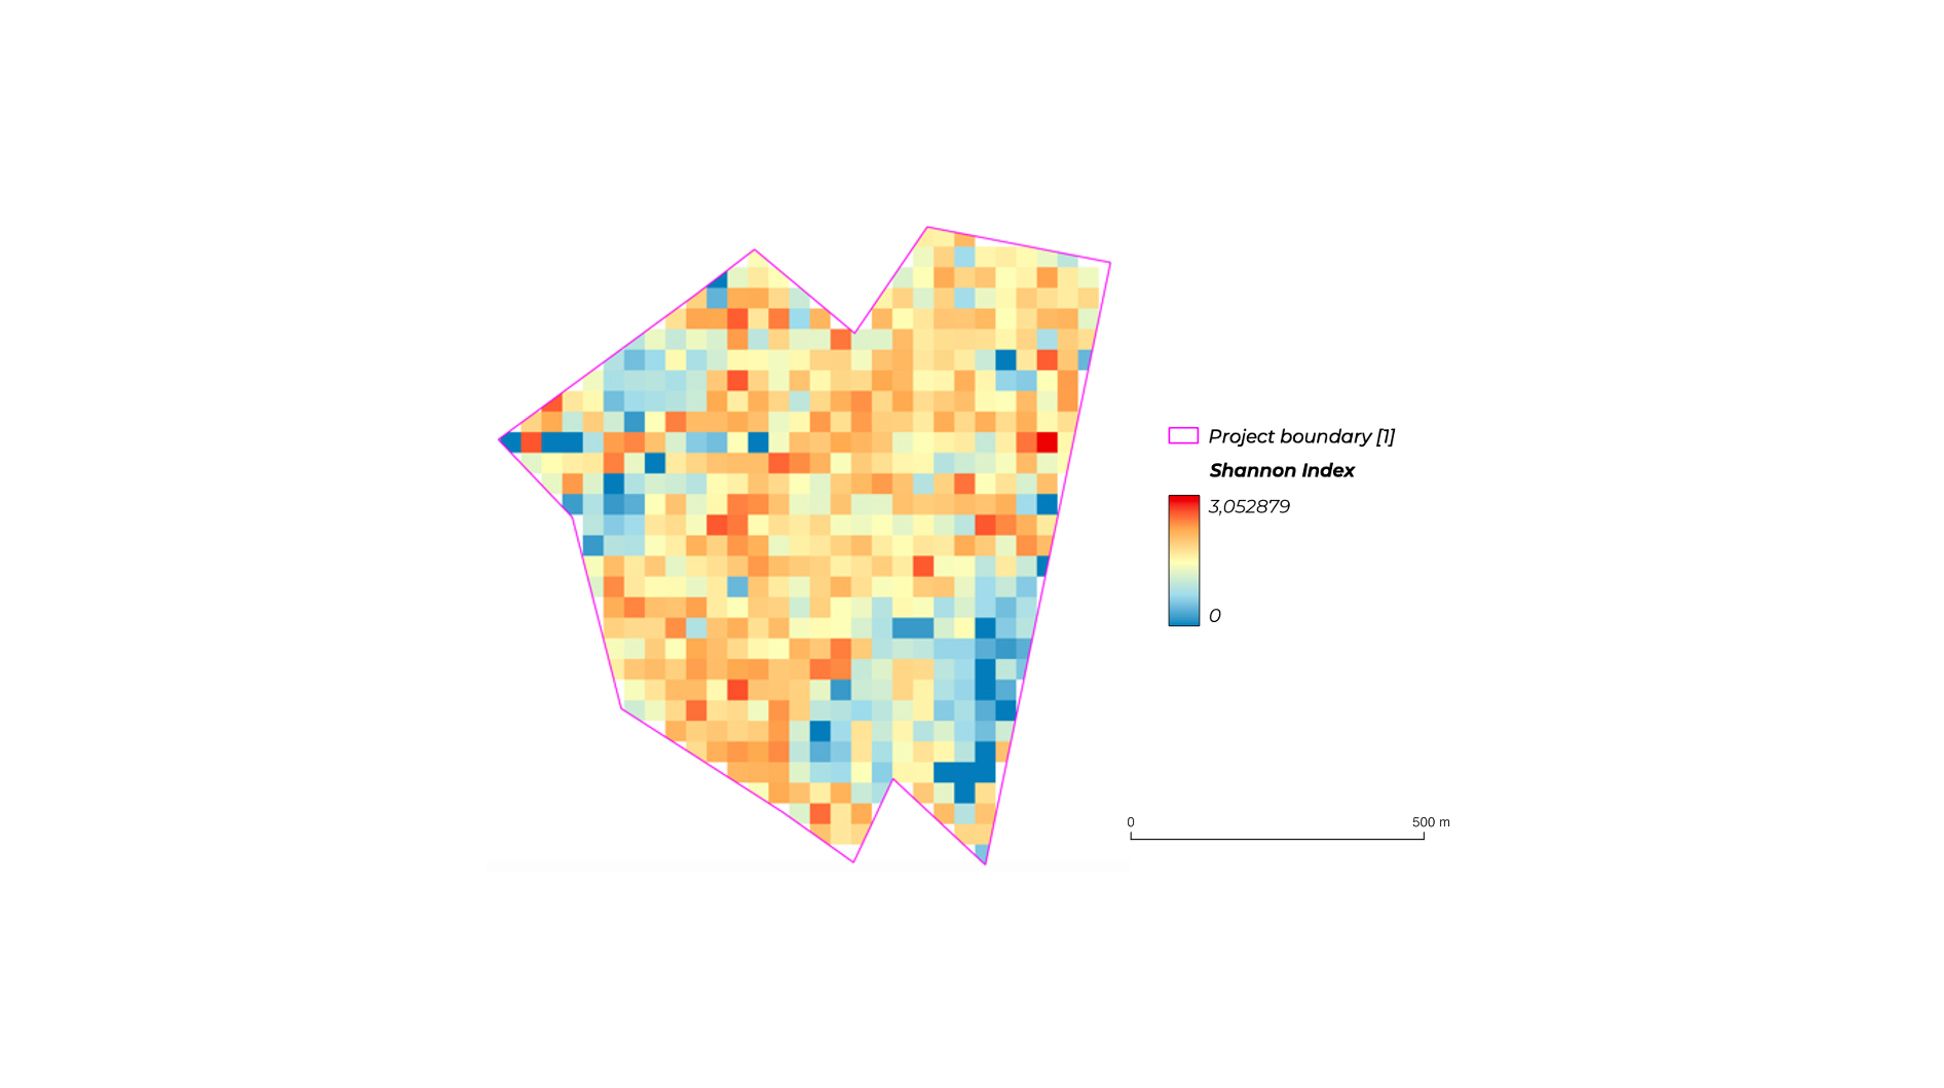
This first tool can then be used to calculate diversity indices, in particular the Shannon index. The Shannon index is the most commonly used diversity index in ecology. It is used to calculate species richness and distribution within a forest. In other words, the more numerous and evenly distributed the plant species, the higher the index.
Reforest'Action uses the Shannon index to determine the specific diversity of spectral species, which is an indicator of the biological (taxonomic) diversity of canopy species. This plant diversity is represented in the form of a heat map, which locates, in warm color, spots of high plant diversity, and in cold color, spots of low plant diversity. It is then possible to follow the evolution of this biodiversity throughout the forest's growth.
“In concrete terms, the forest stand is re-divided into cells of around 1000 m2, in which the abundance of each of the spectral species present is calculated”, explains Richard Sourbès. “In other words, the Shannon index is calculated by a simple change of scale: going from a 10x10 m pixel to a 33x33 m pixel, we obtain zones containing a greater or lesser diversity of spectral species, enabling us to identify the most diverse areas of the plot studied. Within a cell, the more numerous and evenly distributed the spectral species, the higher the Shannon index. Conversely, a cell containing a single spectral species will have a Shannon index equal to zero, representing zero species diversity.”
This mapping is particularly important: it enables field monitoring missions to be steered more effectively, in particular by targeting sampling zones adapted to the results of remote monitoring, and by enabling more precise management recommendations to be formulated. The tool also complements field surveys, which cannot be carried out on all forest stands, as they sometimes extend over dozens or even hundreds of hectares.
Valuable tools for monitoring restoration projects
By making it possible to monitor canopy diversity, the spatial distribution of plant species and forest evolution over time, the spectral species method and its associated tools (spectral species map, Shannon index) are invaluable in forest management and restoration projects.
Because the data obtained is geo-referenced, it is particularly effective for locating potential invasive species that could threaten the stability of the forest ecosystem, or a lack of species diversity at stand level. They can be used to provide an initial diagnosis of canopy plant biodiversity on a forest scale, to better understand the ecological and environmental factors that favor or hinder plant biodiversity, to establish good practices that lead to high diversity, or to take corrective measures in the opposite case.
Forest managers can use this data to develop their management practices to optimize species diversity, as well as the stability and resilience of the forest ecosystem as a whole.
In the medium term, the aim is to be able to calculate the Shannon index for all our projects, in order to monitor the diversity of species represented on the forest plots that have been restored. This index will enable us to measure the impact generated by our projects in terms of plant biodiversity restoration, and will join a range of impact measurement tools currently being developed by Reforest'Action's Innovation & Impact Department.